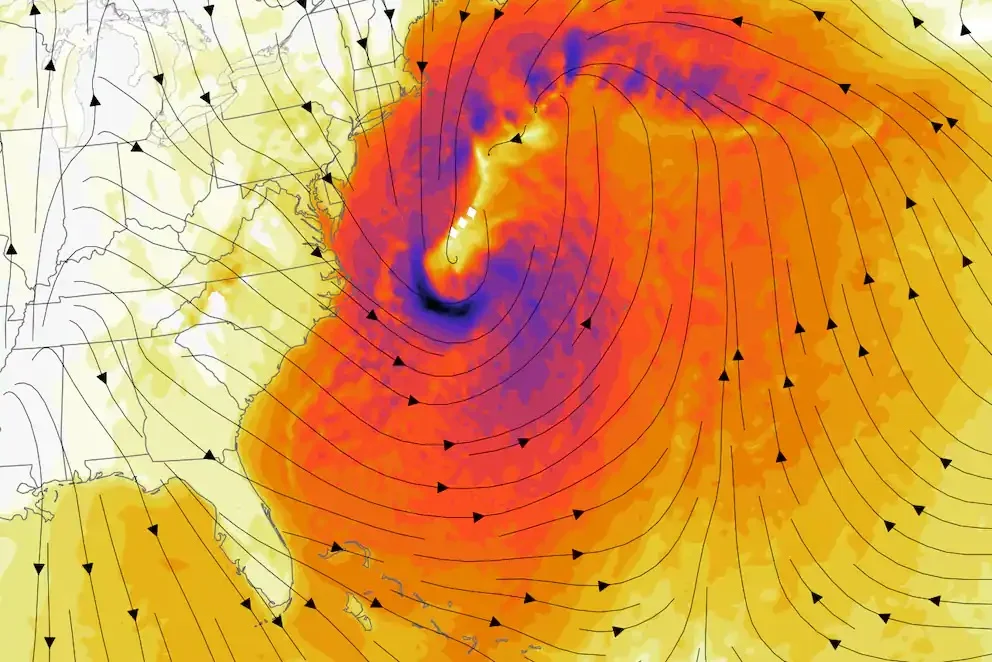
An ECMWF model simulation of winds on Sunday shows a powerful storm near the East Coast.
Washington Post. Where a nor’easter will bring heavy snow, strong winds and waves this weekend
The image above is a wind map. I posted it here first and foremost because it is beautiful. A work of art! Click on it to expand the image.
The map says something about upcoming weather in New York City where I dnow live. T dhe science is also interesting
Important note ECMWF is the European Centre for Medium-Range Weather Forecasts. From that credit we know that the image is not derived from a photograph, but from a mathematical model of the weather that runs on a supercomputer at ECMWF. See the section “Weather Models” below.
What the map tells us
The black lines show how the air is moving, and the arrows show which way the wind is blowing. The colors show how strong the wind is — yellow is lighter wind, and red/purple means very strong wind.
The big swirl offshore is a large storm system, like a giant spinning wheel of air. In the Northern Hemisphere, storms spin counterclockwise, which is what you’re seeing here. Where the lines are packed tightly together and the colors are darker, the winds are strongest. That usually means rough weather nearby — strong winds, high seas, and often heavy rain.
This picture shows a powerful storm over the ocean, with winds wrapping around it and blowing especially hard near its center. In addition, the image shows very large, asymmetric wind envelope with the strongest winds spread over a broad arc rather than a tight, symmetric ring. Symmetry is typical of tropical storms, so it likely that this storm did not form in the tropics and the move northward.
Technical Notes
- The wind map shows a distorted pattern of counterlockwise rotation. Why counterclockwise? That is because of the Coriolis effect.
- The tightly packed streamlines near the center indicate a strong pressure gradient. That means high wind speeds. Analogy: consider a contour map of a steep mountain slope. The steepr the slope, the more tightly packed the contour lines. The steepr the slope the faster the skier.elke
Weather models

A weather model is a program running on a supercomputer that uses physics and real weather data to calculate what the winds should look like. It then “draws” a picture from those calculations. A supercomputer, as in the image above, is a computer that can (a) work with huge amount of data (b) make many calculations very quickly. See these links for more information:
Here’s the basic idea:
. Start with observations: Weather stations, ships, buoys, weather balloons, radar, and satellites measure things like: temperature, air pressure, humidity, wind.
. Put them on a 3-D grid of the Earth. The atmosphere is chopped into millions of boxes (horizontally and vertically).
. Apply the laws of physics. The computer solves the physics equations that describe how air moves:
- Warm air rises, cold air sinks.
- Air flows from high pressure to low pressure.
- The Earth’s rotation bends wind (the Coriolis effect).
- Make one step forward in time.The model calculates what happens next… then next… then next — minute by minute or hour by hour/
- Draw maps like this one.
The wind speeds and directions from the model are turned into arrows, lines, and colors.
The resuling image is a visualization of the model’s calculated winds at a particular time and height in the atmosphere.
Why scientists use models instead of “just looking.”
You can’t directly observe wind everywhere:
- There are no weather stations in most of the ocean
- Winds change with altitude
- Satellites don’t measure wind directly — they infer it
Models fill in the gaps and make the atmosphere behave consistently with physics. Because the calculations an image come from a model:
- It is our best scientific estimate, not a guarantee
- Different models (GFS, ECMWF, etc.) may look slightly different
- The farther into the future, the more uncertainty
But for large, powerful storms like the one shown, models are usually very reliable in showing the overall structure and strength.